Explore State Data,Visualize Insights
Our AI instantly finds and visualizes state-level data from trusted sources
Automated State Research
Our AI scans hundreds of trusted state data sources to find the most relevant and up-to-date information
Smart State Visualization
Automatically selects the best map type and style for your state-level data
Instant Data Insights
Get state-level data effortlessly—just enter a prompt, and our AI finds and visualizes it for you in seconds.
Explore State Data Examples
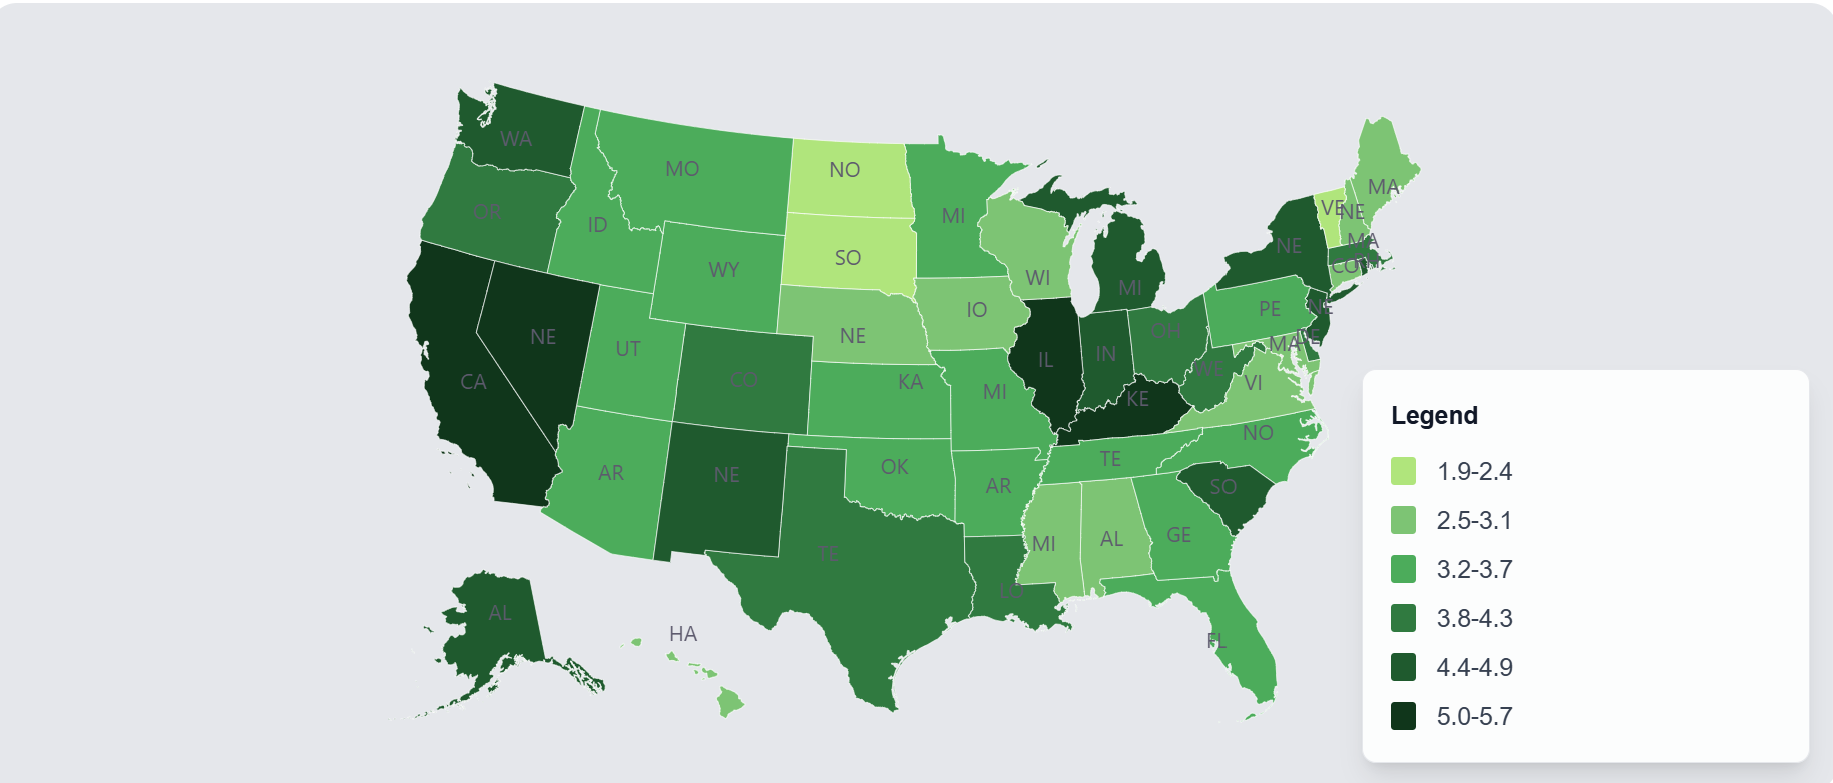
Unemployment Rate by State
A breakdown of the unemployment rate across all U.S. states.
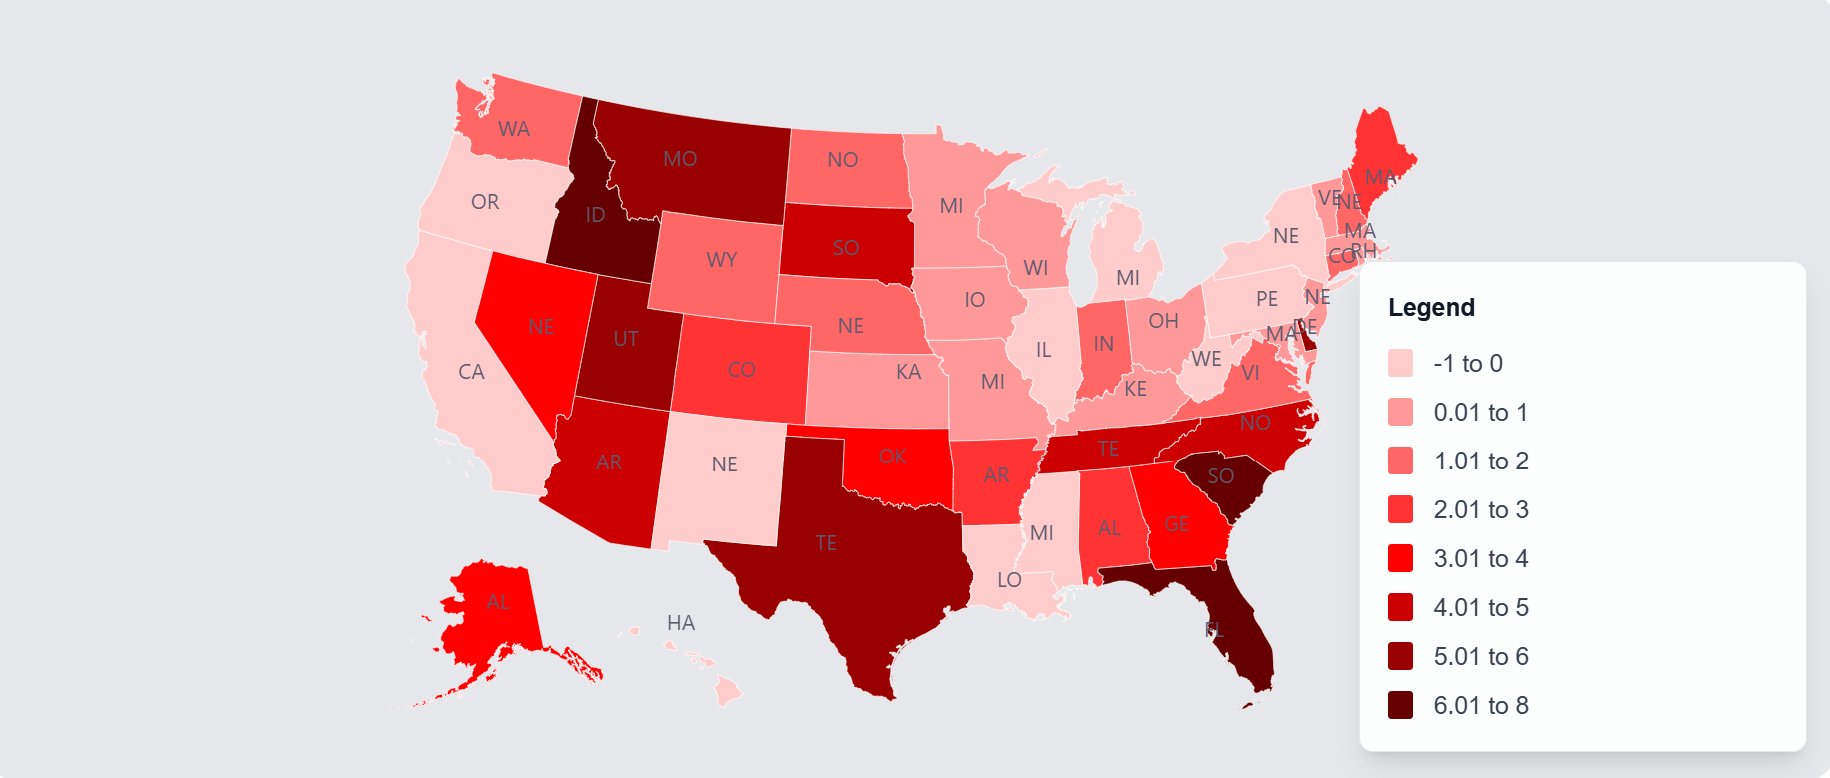
Population Growth by State (2020-2023)
Percentage change in population for each U.S. state from 2020 to 2023.
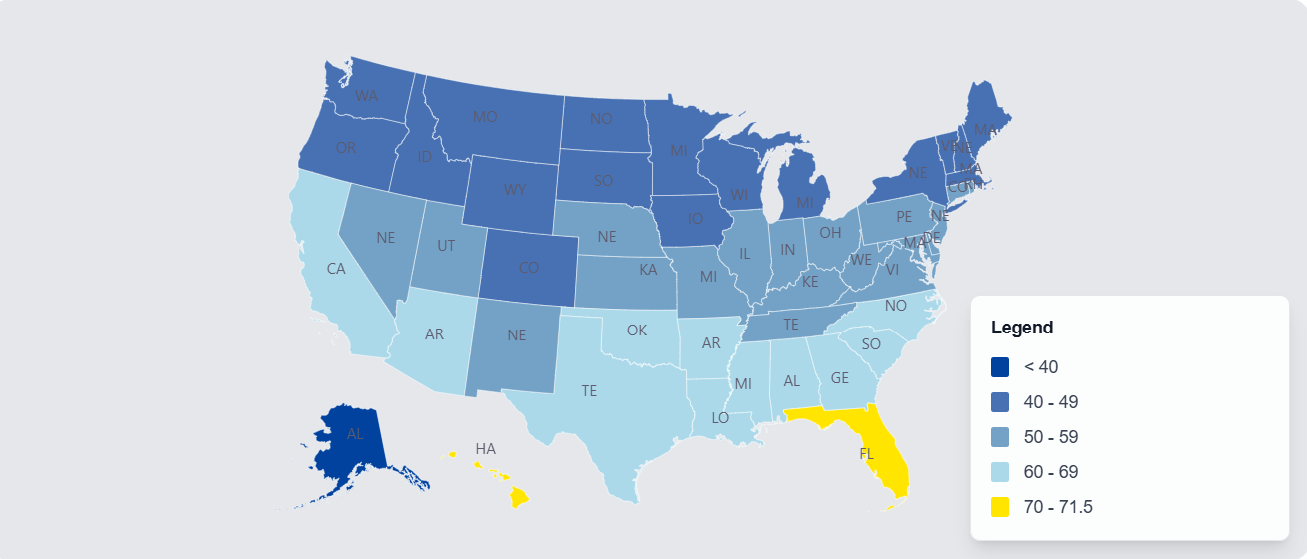
Average Temperature by State
The annual average temperature (°F) for each U.S. state.
Powerful Visualization FeaturesTransform your data into meaningful insights
Choropleth Maps
Visualize state-level data with color-coded maps for intuitive geographic analysis
Interactive Charts
Create dynamic bar charts, line graphs, and scatter plots with hover interactions
World-Level Data
Visualize Country-level data with color-coded maps
Data Export
Export your visualizations and raw data in multiple formats
Multi-Layer Maps
Combine multiple data sets in a single visualization
Sharing & Embedding
Share your visualizations or embed them in other websites
Time Series
Animate data changes over time with interactive controls
Custom Styling
Personalize colors, fonts, and layouts of your visualizations